
On June 5th, 1990 California voters passed Proposition 117, enacting the California Wildlife Protection Act which designated the Mountain Lion a Specifically Protected Mammal in the state. This subsequently made it unlawful to take, possess, transport, import or sell any mountain lion or part or product thereof. Hurray for the mountain lion! (How are we the only state to have passed such a bill still bewilders me). So with this act being in place how do we still hear about cougars being killed in people’s backyards or when an animal ventures to close to a neighborhood? The answer is simple, the act allows certain departments (like the police) to kill any puma that is perceived to be an imminent threat to public health or safety. The mountain lions killed by people in California you hear way less about are the ones shot since they are perceived to be a threat to livestock or are believed to have killed or injured livestock previously. When this situation arises, the livestock owner has to apply for a puma depredation permit from the Department of Fish and Wildlife. Once they acknowledge the damage was indeed done by a mountain lion they issue a permit to take that lion out (aka kill it). The department has been keeping track of the number of permits issued and the number of animals subsequently taken with those permits since 1972. The numbers are quite interesting, and so is a drawn up California map from those numbers.
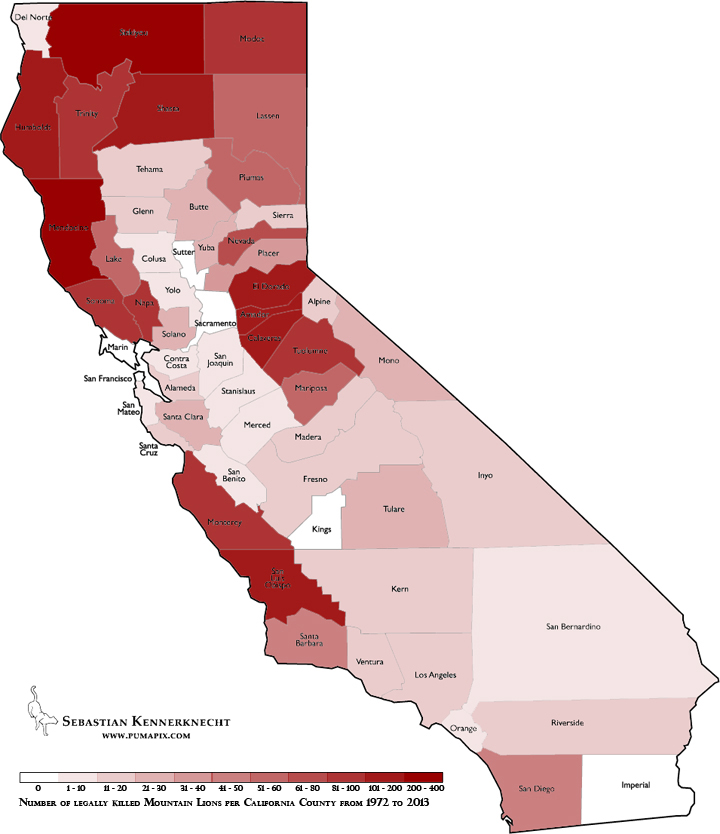
Number of legally killed Mountain Lions per California County from 1972 to 2013
So what do these numbers actually tell us? I am no statistician but I think we can draw a few conclusions from this when looking at the above map and comparing that to the Mountain Lions range in California (see below).
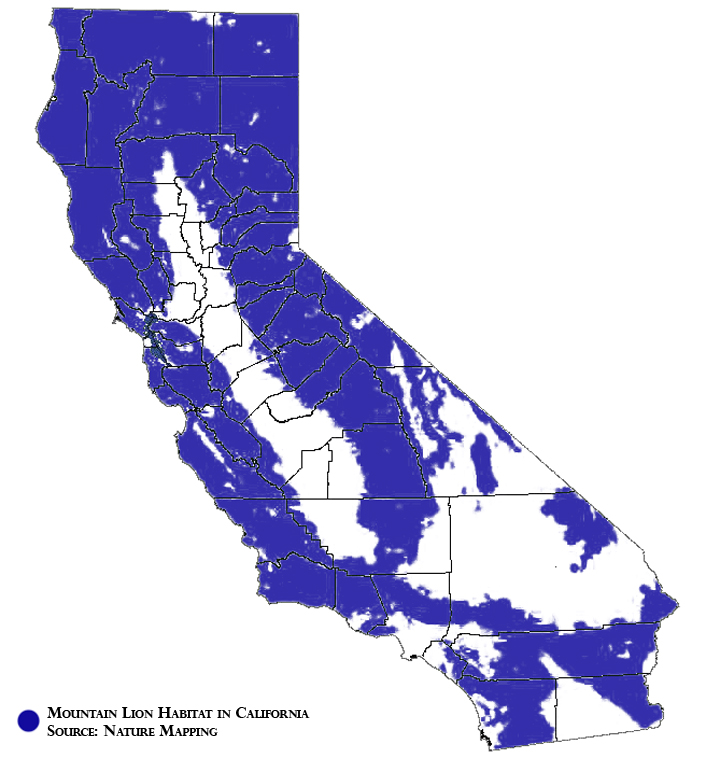
Mountain Lion Habitat in California. Source: Nature Mapping
The obvious conclusion is that mountain lions are only taken where they are actually able to occur (for example no mountain lion has been killed in San Francisco county since 1972 because there is no habitat for them there), what may be more interesting is to look at the possible habitat and then see where the most depredation takes place. Assuming that a mountain lion would attack livestock with the same likelihood no matter what kind of other external pressures its faced with (though this is of course impossible), you would conclude from the map that there are simply more mountain lions in the northern part of California, in the Big Sur area, and along the western part of the Sierras. This especially makes sense when you look at counties like San Mateo, Santa Cruz, and Santa Clara. All three counties are considered being mountain lion habitat, yet the depredation permit numbers are not very high. Is this because all three counties are heavily populated and there are simply less lions there than say Mendocino County? Is it because there is less livestock in these areas? What conclusions do you draw from this? Can we say that this means that counties like Siskyou or Shasta have the highest population numbers of pumas for California?
Another interesting thing to look at is number of animals actually killed compared to permits issued. I drew up another map to look at this comparison.
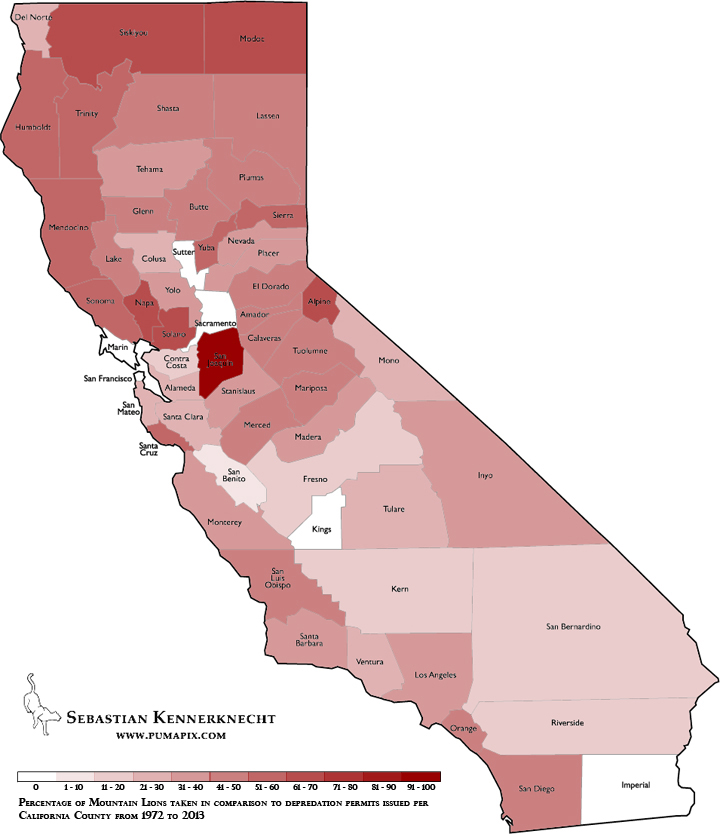
Percentage of Mountain Lions taken in comparison to depredation permits issued per
California County from 1972 to 2013
This map shows that no matter what county a permit is issued in, on average, about half of the issued permits result in a dead lion. Interestingly Siskyou county again is on the higher end of the scale with 66% of permits resulting in a dead lion. For there to be a dead lion, there needs to be a live lion in the first place, with that I simply want to say that it again seems to show that the northern counties in California may boast the highest mountain lion numbers. Livestock predation would most likely be caused by transient animals, individuals that have only recently become independent from their mother and that are desperately looking for food, or older individuals which have difficulty hunting wild game. With such high numbers of animals being killed in these northern counties, it seems that the overall adult breeding population is doing better there than the more central and southern parts of the state.
Finally we can take a look at the change in number of animals legally taken over the 41 years of records.
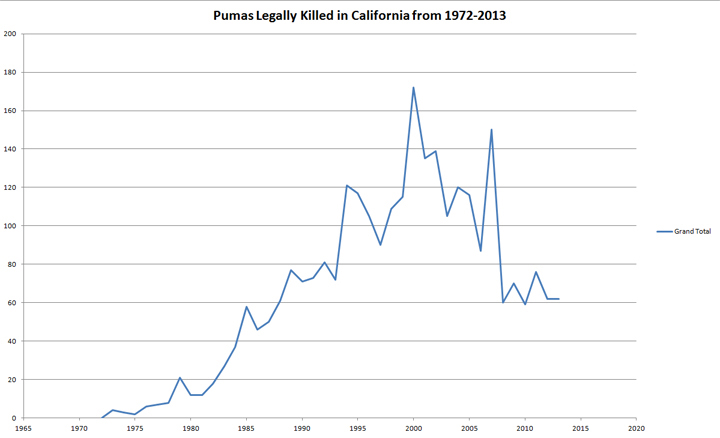
Pumas Legally Killed in California from 1972-2013
What’s interesting here is to see how drastically the number of animals killed increased from 1972 until 2000, with the 1990 ban not seeming to have an impact on the trend. This could partially be because the number of animals actually increased and therefore there was a higher chance of there being conflict with livestock, or that the ban had no impact what so ever. The other interesting thing is that there has been a tremendous decrease in the number of animals killed since 2007. Is this because pumas are avoiding livestock or simply because there are less of them? It seems to be somewhat stable now, which may imply that the overall California population may be stable as well.
Since we don’t have numbers for the actual population size of mountain lions in California, nor do we have numbers for areas with the highest population sizes, these depredation numbers may give us the best idea of whats going on with the population overall.
Sources:
Department of Fish and Wildlife – County Mountain Lion Depredation Annual Statistics – http://www.dfg.ca.gov/wildlife/lion/dep-statistics.html