Big Picture Natural World Photography Competition Finalist!

big picture natural world photography competition finalist photo - pampas cat

Pampas Cat (Leopardus colocolo) in altiplano at night, Ciudad de Piedra, western Bolivia

I am honored to announce that my Pampas Cat picture is a finalist in the terrestrial wildlife category in the Big Picture Natural World Photography Competition, organized by the California Academy of Sciences.

Congratulations to all the winners and finalists of this years competition! I would like to especially congratulate Nayan Khanolkar for the coolest camera trap shot of a leopard I have ever seen and Pete Oxford, who is the definition of a conservation photographer, and a personal hero of mine.

You can see the overall category winners here:
http://bigpicturecompetition.org/the-2016-winning-images/

and the other terrestrial wildlife finalist images here:
http://bigpicturecompetition.org/finalists-terrestrial-wil…/

Finally, you will be able to see all the pictures in person starting July 29th, 2106. I hope you are able to!

This Pampas Cat photograph was taken as part of the Cat in Thin Air project and would not be possible without the help of the Andean Cat Alliance, Juan Carlos Huaranca Ariste, Alejandra Rocio Torrez Tarqui, and Ma Lilian Villalba. Thank you to all of you!

*If you are interested in purchasing any of the pictures displayed in this post, please check out my fine prints page for pricing.*

California Wildlife Photography Workshop Dates Released

california wildlife photography workshop

There are workshops covering everything from salamanders to sea otters!

In anticipation of next year, I finalized the dates for a bunch of California wildlife photography workshop classes, mainly around Santa Cruz and the San Francisco Bay Area. You can check out all the info here: http://www.pumapix.com/wildlife-photography-workshops-and-lessons/

Workshop dates are as follows:
February 27th, 2016 – Santa Cruz and Moss Landing, California – Sea Otter Photography Workshop
February 28th, 2016 – Santa Cruz, California – Salamanders of the central coast of California Photography Workshop
May 14th-15th, 2016 – Pinnacles National Park, California – California Condor Photography Workshop
May 21st, 2016 – Santa Cruz, California – Brown Pelican Photography Workshop
August 20th, 2016 – Point Reyes National Seashore, California – Tule Elk Photography Workshop
October, 22nd through November 5th, 2016 – New Zealand – Birds of New Zealand Photography Workshop

California Wildlife Gallery on BBC Wildlife’s Website

The magazine posted seventeen of my California Wildlife pictures on their website!

The magazine posted seventeen of my California Wildlife pictures on their website!

The editors at BBC Wildlife magazine just let me know that my story pitch made it to the final round of selection for their BBC Wildlife Photographic Grant, sponsored by Kowa. Though I did not get the grand prize, I am honored that the editors picked my pitch to be in the final and that they asked me to submit a gallery of images for their website. Thank you photo editors! And am very much looking forward to finding out who the overall winner is in a couple of days!

Pumas are Better for our Health

You read that correctly, pumas are better for our health! How can a wild animal like a mountain lion be better for our health? We have all heard about the web of life. All things are connected, and there is a natural balance within an ecosystem. Pumas show us how removing part of that system shifts that balance, creating a system that is harmful to people.

Web of Life

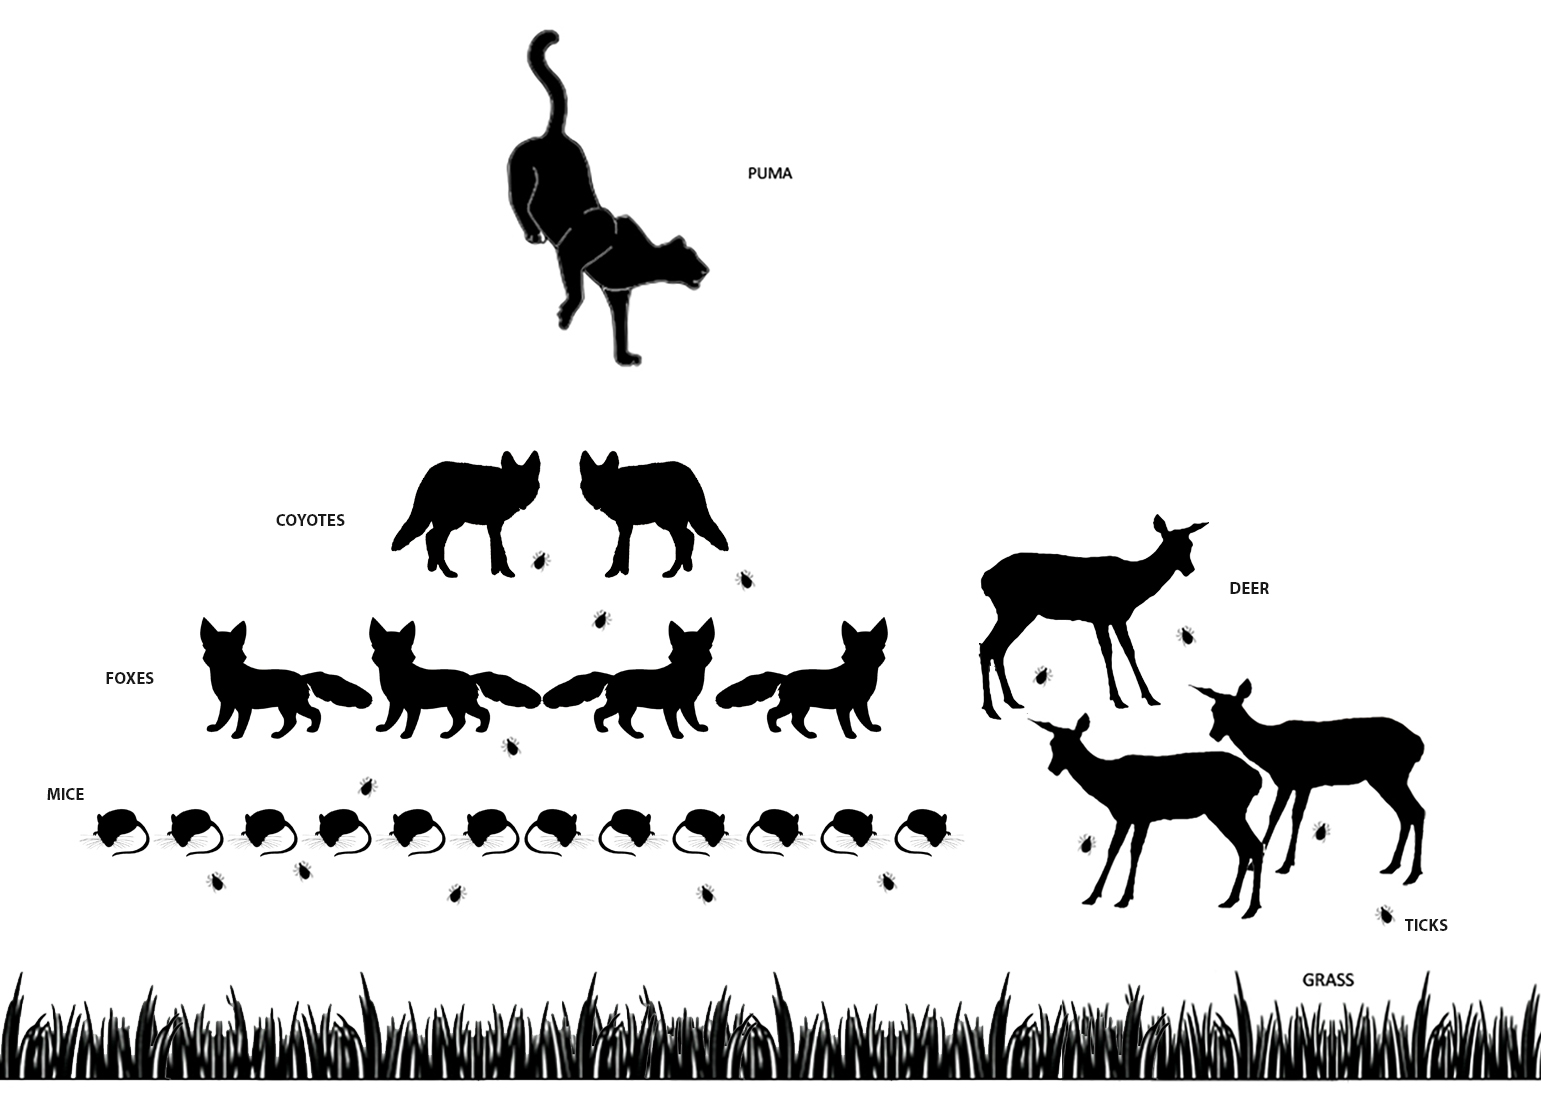
Let’s first look at the web of life that a puma lives in:

Cougars are better for our health

The web of life for a Puma (very simplified)

In this very simplified (though accurate) system, pumas play two roles as the top predator in the ecosystem. They feed primarily on deer, and they keep coyote numbers in check. One one hand, this leads to a normal sized deer population for the ecosystem. On the other it means that there are more foxes in the system, because there are less coyotes predating them. This leads to mouse numbers that are also at normal levels for the system. Ticks feed all the animals within the system.

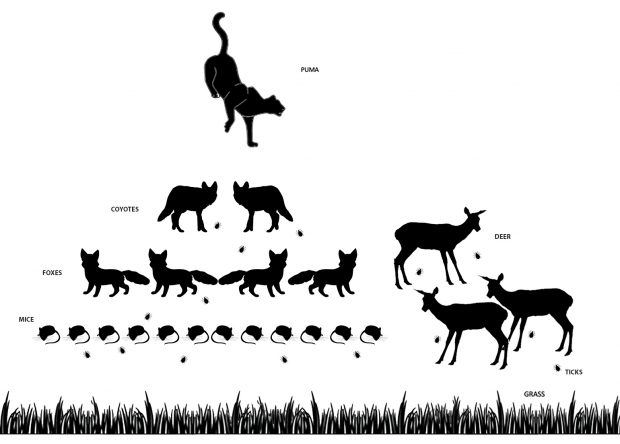
Now let’s compare the above system to that of the east coast of the United States, where pumas are no longer found.

Pumas are Better for our Health

Web of Life without the Puma

Without the pumas, deer numbers have increased tremendously, causing vegetation to diminish due to overgrazing. More importantly, coyote numbers have increased, causing there to be fewer foxes, in turn leading a much higher number of deer mice. In this system there are a lot more deer for adult ticks to feed on and a lot more mice for larval ticks to feed on.

This is where the health aspect comes in. Ticks carry disease, including Lyme disease. Ticks get Lyme disease when they feed on mice, who are hosts to the disease causing bacteria. With more ticks present, there may not be a larger percentage of ticks that carry Lyme disease but there will be a larger number of individuals that are vectors of it. Due to the fact that cougars are not controlling deer or indirectly mouse numbers on the east coast, more Lyme disease carrying ticks are around, which leads to a higher rate of incidence for the disease in the area.

Tick and Lyme Maps

Let me illustrate the point with some maps.

Tick species ranges that carry Lyme disease in the US

Tick species ranges that carry Lyme disease in the US

In the US, both the Black-legged Tick (Ixodes scapularis) and the Western Black-legged Tick (Ixodes pacificus) carry and transmit Lyme disease.

This is the area in which Lyme disease has the highest incidence rate (or, where it happens the most):

The fifteen states with the highest incidence rate of Lyme disease in the US

The fifteen states with the highest incidence rate of Lyme disease in the US (see Lyme Disease Association Analysis) — the darker the red the higher the number of incidences

As you can clearly see, the highest chance of infection is limited to the east Coast.

Now let’s look where Pumas currently live in accordance with the above data:

Mountain Lion presence and their relation to Lyme disease infection

Mountain Lion presence and their relation to Lyme disease infection

Even though Lyme disease and their vectors are present on the west coast of the US, mountain lions keep the tick numbers low (by keeping the deer and mouse numbers lower), therefore creating an overall healthier system for people. More mountain lions eventually means a lower chance of getting Lyme disease.

Is there space for pumas on the east coast?

Historically, cougars used to occupy the east coast where Lyme disease is so prevalent now, but they were extirpated from the region in the early 1900’s. Could a case be made for re-introducing cougars to the east coast? Now that they have been gone from the region for hundreds of years? Is there even space for them? Even though the western United States has greater areas of fully protected land, the eastern states still have plenty of habitat for pumas as well.

US population density - Copyright Ian Offord

US population density – Copyright Ian Offord

The population density map shows that cougars have no space left on the actual east coast. Nor would you want them to wander into New York City or Boston. Once you are more inland however, the population density is low enough where you can have successful co-existence between these cats and people. Having an re-introduction plan would help of course but even naturally, pumas are moving more and more east as time passes. Maybe sooner than later, Lyme disease will be less of an issue in the States, and all due to a wild cat.


Puma Depredation Numbers in California and Possible Conclusions

On June 5th, 1990 California voters passed Proposition 117, enacting the California Wildlife Protection Act which designated the Mountain Lion a Specifically Protected Mammal in the state. This subsequently made it unlawful to take, possess, transport, import or sell any mountain lion or part or product thereof. Hurray for the mountain lion! (How are we the only state to have passed such a bill still bewilders me). So with this act being in place how do we still hear about cougars being killed in people’s backyards or when an animal ventures to close to a neighborhood? The answer is simple, the act allows certain departments (like the police) to kill any puma that is perceived to be an imminent threat to public health or safety. The mountain lions killed by people in California you hear way less about are the ones shot since they are perceived to be a threat to livestock or are believed to have killed or injured livestock previously. When this situation arises, the livestock owner has to apply for a puma depredation permit from the Department of Fish and Wildlife. Once they acknowledge the damage was indeed done by a mountain lion they issue a permit to take that lion out (aka kill it). The department has been keeping track of the number of permits issued and the number of animals subsequently taken with those permits since 1972. The numbers are quite interesting, and so is a drawn up California map from those numbers.

Number of legally killed Mountain Lions per California County from 1972 to 2013

Number of legally killed Mountain Lions per California County from 1972 to 2013

So what do these numbers actually tell us? I am no statistician but I think we can draw a few conclusions from this when looking at the above map and comparing that to the Mountain Lions range in California (see below).

Mountain Lion Habitat in California. Source: Nature Mapping

Mountain Lion Habitat in California. Source: Nature Mapping

The obvious conclusion is that mountain lions are only taken where they are actually able to occur (for example no mountain lion has been killed in San Francisco county since 1972 because there is no habitat for them there), what may be more interesting is to look at the possible habitat and then see where the most depredation takes place. Assuming that a mountain lion would attack livestock with the same likelihood no matter what kind of other external pressures its faced with (though this is of course impossible), you would conclude from the map that there are simply more mountain lions in the northern part of California, in the Big Sur area, and along the western part of the Sierras. This especially makes sense when you look at counties like San Mateo, Santa Cruz, and Santa Clara. All three counties are considered being mountain lion habitat, yet the depredation permit numbers are not very high. Is this because all three counties are heavily populated and there are simply less lions there than say Mendocino County? Is it because there is less livestock in these areas? What conclusions do you draw from this? Can we say that this means that counties like Siskyou or Shasta have the highest population numbers of pumas for California?

Another interesting thing to look at is number of animals actually killed compared to permits issued. I drew up another map to look at this comparison.

Percentage of Mountain Lions taken in comparison to depredation permits issued per California County from 1972 to 2013

Percentage of Mountain Lions taken in comparison to depredation permits issued per
California County from 1972 to 2013

This map shows that no matter what county a permit is issued in, on average, about half of the issued permits result in a dead lion. Interestingly Siskyou county again is on the higher end of the scale with 66% of permits resulting in a dead lion. For there to be a dead lion, there needs to be a live lion in the first place, with that I simply want to say that it again seems to show that the northern counties in California may boast the highest mountain lion numbers. Livestock predation would most likely be caused by transient animals, individuals that have only recently become independent from their mother and that are desperately looking for food, or older individuals which have difficulty hunting wild game. With such high numbers of animals being killed in these northern counties, it seems that the overall adult breeding population is doing better there than the more central and southern parts of the state.

Finally we can take a look at the change in number of animals legally taken over the 41 years of records.

Pumas Legally Killed in California from 1972-2013

Pumas Legally Killed in California from 1972-2013

What’s interesting here is to see how drastically the number of animals killed increased from 1972 until 2000, with the 1990 ban not seeming to have an impact on the trend. This could partially be because the number of animals actually increased and therefore there was a higher chance of there being conflict with livestock, or that the ban had no impact what so ever. The other interesting thing is that there has been a tremendous decrease in the number of animals killed since 2007. Is this because pumas are avoiding livestock or simply because there are less of them? It seems to be somewhat stable now, which may imply that the overall California population may be stable as well.

Since we don’t have numbers for the actual population size of mountain lions in California, nor do we have numbers for areas with the highest population sizes, these depredation numbers may give us the best idea of whats going on with the population overall.

Sources:
Department of Fish and Wildlife – County Mountain Lion Depredation Annual Statistics – http://www.dfg.ca.gov/wildlife/lion/dep-statistics.html